When looking at the reporting options in Dynamics, it sometimes feels that there are just way too many, and, even though there are lots of good ones, there is always something that seems to be missing.
Just so we could start somewhere, let’s see what Microsoft has to say:
https://technet.microsoft.com/en-us/library/dn531183.aspx
In other words, we are talking about SSRS, Dashboards, and Power BI. Realistically, though, dashboards are nothing but layout pages where we can add charts and views, so we should really be talking about charts and views there. Also, Power BI is somewhat limited in the on-prem environments, and SSRS is somewhat limited in the online environments.
But that’s not all. There are other options, too. After all, the purpose of reporting is to give additional insight into the data we have in the system, and, come to think of it, there are at least a few more options:
- Advanced Find
- Views
- Excel export
- Excel/Word templates
- Power Query in Excel
- Within SSRS category, we have reporting wizard and custom SSRS reports
- It’s also possible to use Dynamics data with Cognos BI or other external tools
- And, on top of that, there are calculated and rollup fields in Dynamics which we can use in conjunction with all the other options (probably more so with the views/charts)
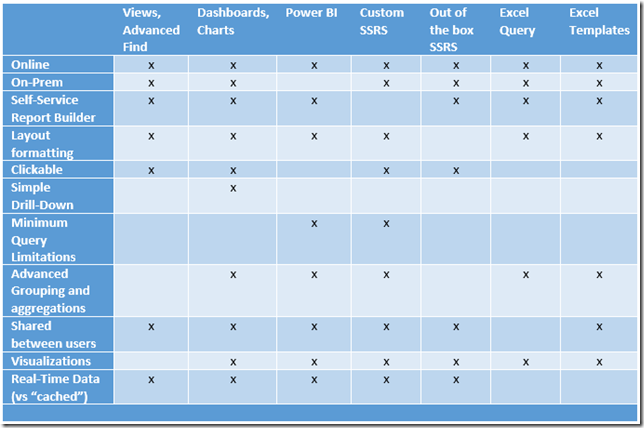
So, how do we choose? I have compiled a table which, even if not very detailed, might get you started (and, also, might put this comparison in perspective):
Just a few clarifications:
- Minimum Query Limitations – there are always some limitations, mostly because of FetchXML(but, also, because of how different tools are treating fetch), but SSRS and Power BI will have less of those
- Clickable – this is all about having clickable links in the report to open records directly in Dynamics
- Simple Drill-Down – it just comes with the dashboards. Looks like no other tool/approach can easily beat it
Now if it looks like Dashboards are winning this race, not necessarily. Dashboards are really good for a lot of things, but, in a way, it’s a half-cooked tool. If you compare Power BI visualizations with the dashboard, you’ll see that Power BI is more powerful. The same goes for SSRS. Actually, Power BI (and SSRS) will likely beat dashboards anywhere – dashboards will be offering some basic option, and Power BI/SSRS will be offering an enhanced alternative.. except when it comes to the “drill-down” feature.
How do you choose, then? Is it on a case-by-case basis, or would you just say “go with Power BI”(for example) these days?

Hi have you tried integrating PowerBI within a Dynamics CRM Dashboard? This will also add the simple drill-down fucntionality in the dashboard directly; https://docs.microsoft.com/nl-nl/dynamics365/customer-engagement/basics/add-edit-power-bi-visualizations-dashboard
Hi Alex, for complex documents from Dynamics and in case you want to integrate charts into documents and presentations as a combination of Power BI and images you might want to check out this: https://www.dox42.com/de/Modules/dox42DynamicsCRM
Here is the english link as well: https://www.dox42.com/Modules/dox42DynamicsCRM
I generate record-specific D365 URLs in Power Query (e.g. link to Accounts by ID) that I display in table visuals in Power BI, so once these are embedded they are clickable. However clicking opens a new browser tab.