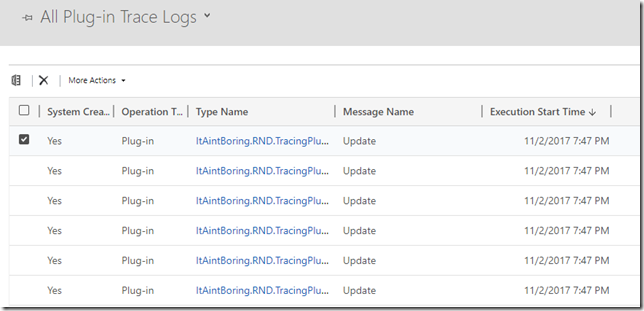
Tracing service can make it much easier for plugin developers to understand what’s happening in the plugin, especially when there is no other way to debug the code. I was wondering, though, if there would be an obvious performance impact when using the tracing service, so I did some testing tonight:
The results ended up being a bit unexpected.. Here is what happened:
1. I ran those tests in the Dynamics 365 (V9) trial environment
2. To test tracing service performance, I registered a plugin on the update of account entity which would make a few calls to the tracing service:
        public void Execute(IServiceProvider serviceProvider)
        {
            ITracingService tracingService =
                (ITracingService)serviceProvider.GetService(typeof(ITracingService));
            IPluginExecutionContext context = (IPluginExecutionContext)
                serviceProvider.GetService(typeof(IPluginExecutionContext));
            IOrganizationServiceFactory serviceFactory = (IOrganizationServiceFactory)serviceProvider.GetService(typeof(IOrganizationServiceFactory));
            IOrganizationService service = serviceFactory.CreateOrganizationService(context.UserId);


            tracingService.Trace("Message from tracing Plugin..");
            tracingService.Trace("Another message from tracing Plugin..");
            tracingService.Trace("Yet another message from tracing Plugin..");

        }
As you can see, there is nothing extraordinary in that plugin..
3. Then, I created a small console application that would update the same account record in a loop:
         for (int i = 0; i < 100; i++)
         {
            var updatedAccount = new Entity("account");
            updatedAccount.Id = account.Id;
            service.Update(updatedAccount);

         }
Then I did the timing (in milliseconds, how much time it would take to run the for loop above), and here is what I got:
With only 1 call to the tracing service in the plugin AND tracing DISabled, it was taking about 20 seconds
With 3 calls to the tracing service in the plugin AND tracing DISabled, it was taking about 20 seconds
With 3 calls to the tracing service in the plugin AND tracing ENabled, it was taking the same 20 seconds
With the plugin execution step completely disabled, it was taking about 19 seconds
There was some difference between the individual test runs, but, on an average, those were the numbers. Essentially, there was no difference at all, other than for those tests where the plugin was disabled.. they were slightly faster.
And it does not, really, matter what are the absolute numbers – all I wanted to see is whether there would be any obvious performance impact with tracing enabled, and, it seems, there was not. At least not on these tests.
Which is not what I expected.. And that’s why it’s both concerning and encouraging at the same time. Common sense seems to be telling me that there should be some difference, and, so, we should not be overusing tracing in the plugins. But these tests are telling me that it’s far not as bad to have tracing there as it might have been, so, it seems, it’s a relatively safe technique.
And, by the way, if you need more details about the tracing service, have a look at this page:
https://msdn.microsoft.com/en-us/library/gg328574.aspx#loggingandtracing
Happy 365-ing!

Interestng analysis, thank you for that! 🙂
It brings up the question “Did they implement tracing super efficient so it doesn’t affect performance, or did they not implement the disabling properly, so you don’t gain any performance by disabling it?”
Also would recommend the new docs site instead of slowly dying msdn: https://docs.microsoft.com/en-us/dynamics365/customer-engagement/developer/debug-plugin#logging-and-tracing
And, of course, I take every chance to promote the Plugin Trace Viewer for XrmToolBox 😉 http://ptv.xrmtoolbox.com
I have no choice but to write a post about the plugin trace viewer after this:))