You may have heard that we can now use Monitor with model-driven applications. It can provide some very useful context about the client-side behavior of your apps, but there is one option which may be particularly useful when troubleshooting end-user issues.
It seems this process is supposed to be done through the “Invite” button below:
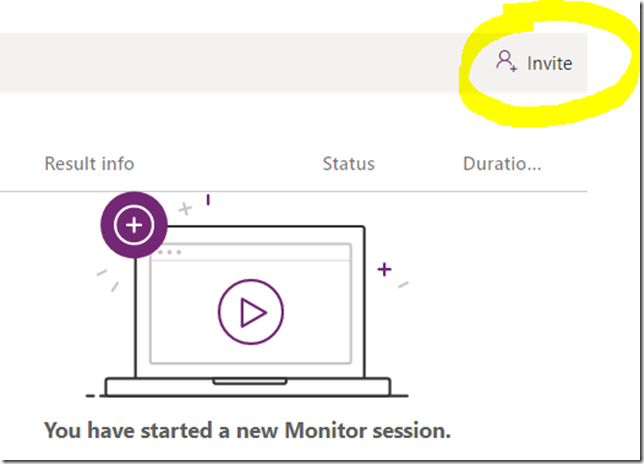 but there are a few things which did not work for me when I tried doing it that way, so here is a workaround for now.
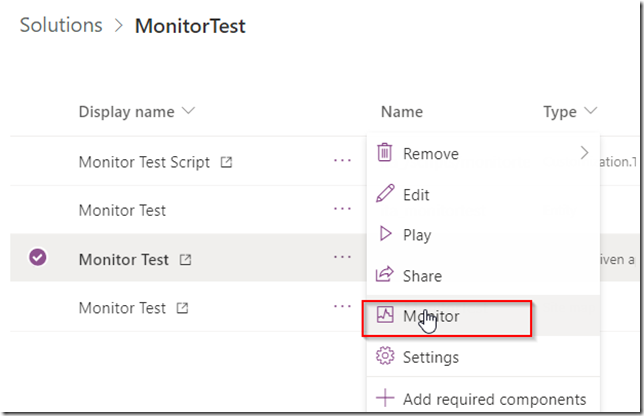
Using your own account, open Monitor page for your app from the maker portal:
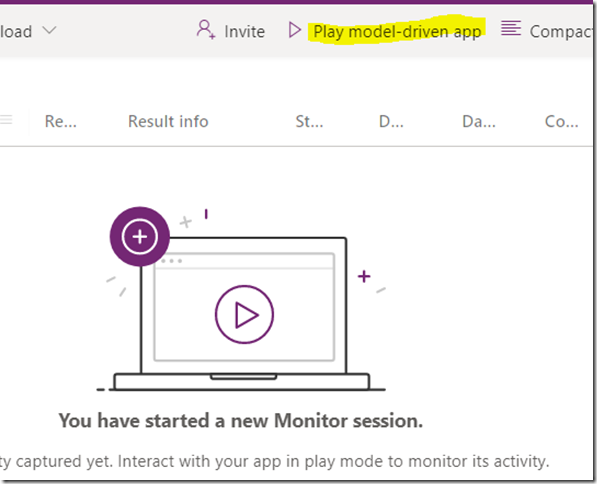
Once the monitor shows up, click “Play Model-Driven App”
Copy the url so you can send it to the user
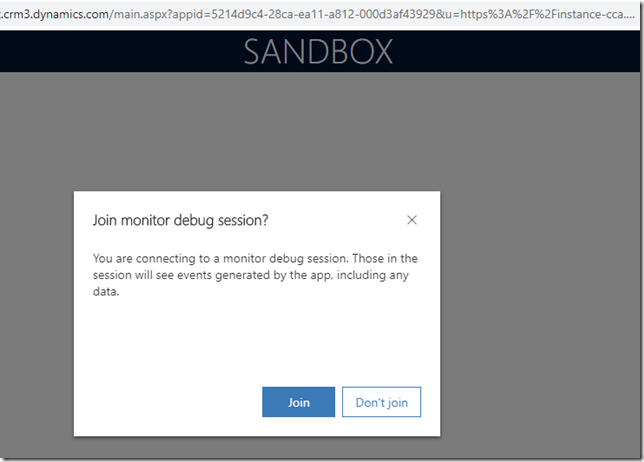
On the screen below, do not choose “join” right away – first, copy the url from the browser address bar:
Then send that url to the user and click Join
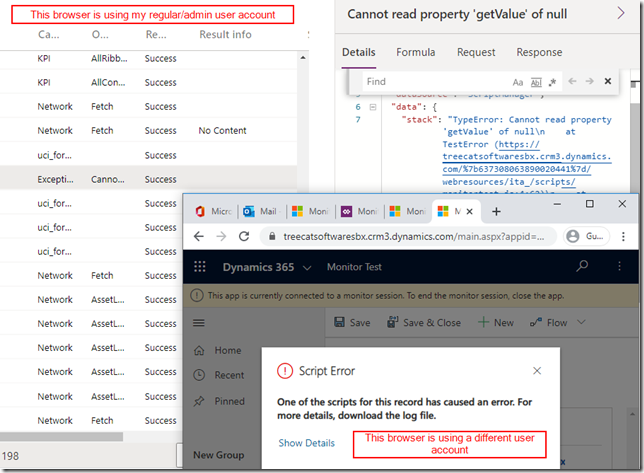
Once the user receives the url, they can open that url in the browser, join the session, and you will see all their session details in your original monitor session:
How/why is this helpful?
Well, you can spare your users from having to send you the log files to start with, and, besides, you may be able to see not just the error itself in the monitor session, but, also, a lot of contextual client-side information about the error itself, and, also, about the client-side events which happened before or after the error and which might have lead to the error.
