The other day, I was wondering if I could, somehow, come up with an app that would be tracking twitter mentions of certain keywords, and, then, do some analytics on top of that.
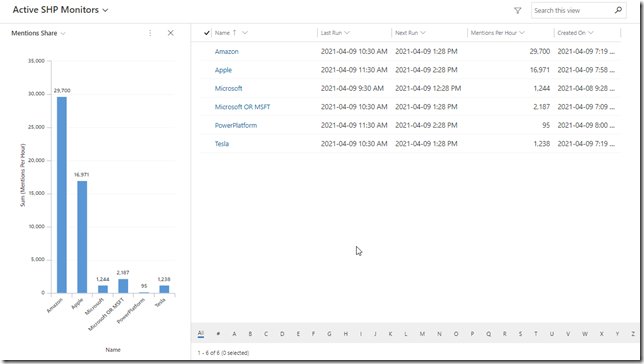
And you know what? It took me 4 hours in total to get it up and running on Power Platform – the screen below is an illustration of how it worked out:
Forgive me, Microsoft. I tried making your bar higher, but Amazon has definitely taken the lead, and, then, there is Apple… but, at least, Tesla is lagging behind![]()
What’s involved there?
There are a few pieces so far:
- I’m using Twitter as a “data source”
- In order to get the data from Twitter, I’m using a Power Automate flow
- All the data is, then, stored in Microsoft Dataverse
- And there is a Model-Driven Power App to present that data and to configure the search queries
With this in place, I could, now, add Power BI to the mix and start doing more analytics as I keep getting more data. I could also add other social platforms to the mix and start collecting data from there. Potentially, I might have to start creating custom connectors or add Azure Functions, too. The sky is the limit in terms of how advanced and how complex this can be, but that’s fine. Most importantly, it took almost no time not only to prototype the app, but to get a working version that’s already yielding some interesting output.
So, then, if you wanted to try it out, here is what’s involved:
1. Download solutions from git – there are both managed and unmanaged versions
https://github.com/ashlega/ItAintBoring.SHPMonitoring/tree/master/Solutions
2. Import managed solution into your environment – you’ll have to configure connections along the way
Just make sure to use maker portal – don’t use classic experience or those connections won’t be configured properly
I am assuming you have a twitter account, btw![]()
3. Once you have it imported, configure your first monitor
Open “Social Hype Monitoring” app and choose “SHP Monitors” in the navigation pane:
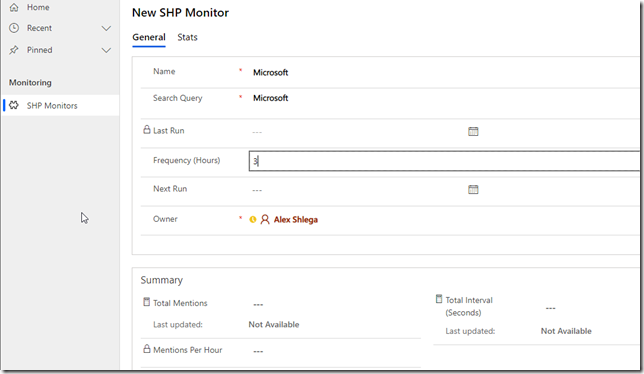
Start creating a new one – here is how you can set it up, for example:
For the search Query, since it’s only working with Twitter at the moment, here is a link to the Twitter search query syntax: https://developer.twitter.com/en/docs/twitter-api/v1/rules-and-filtering/search-operators
- Once the monitor record above is created, it may take some time (up to an hour) before a Power Automate flow that’s scheduled to run every hour kicks in and starts processing those monitor records. Once it does kick in, you’ll start seeing data coming in. Here is how it may look like:

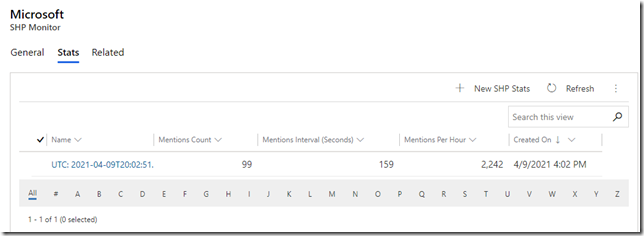
Each of those “SHP Monitor” records will have “SHP Stats” records linked to it. Those correspond to the individual data collection runs:
So, over time, there will be more of those for each SHP Monitor (and this is why there is “Frequency” column – that’s how you can control how often data collection should be happening).
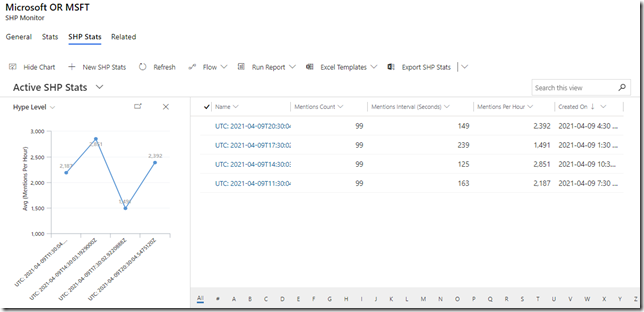
And, yes, there are a few charts, though it becomes a little tricky. Charts are not available for subgrids (unlike in the classic interface), but you can still show/hide a chart if you navigate to Related->SHP Stats for a specific monitor:
In the meantime, I’m thinking of a bunch of things I could probably showcase using this app, so, maybe, that’s what’s coming next?
Have fun!


