With the performance insights feature available in preview now, I was wondering what is it I could possibly learn about one of my applications?
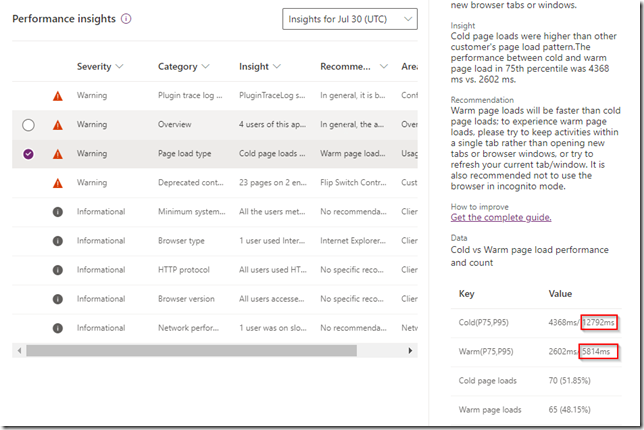
For the most part, what I found there is not, necessarily, actionable. There are a few informational messages, and there are a few warnings; however, there is one insight that I got curious about:
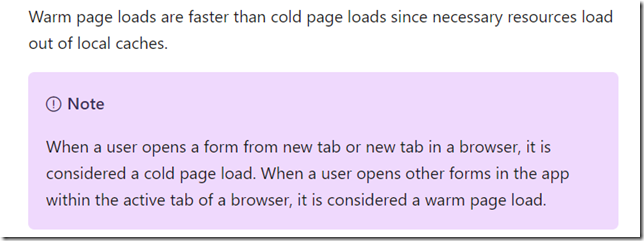
So, cold page loads are slower than warm page loads, and they can be as much as 100% slower. The difference between cold page loads and warm page loads is not, necessarily, that we would be opening our app for the first time on that day – it’s more about how we’d be opening it. As long as we are “starting” a new browser and/or using a new tab, the page load is considered to be “cold”. Otherwise, when we are using existing browser window/tab, that’s a warm load:
That reminded me of the discussion I had with a colleague a couple of weeks ago. Both of us kept noticing slow load times in different applications, here and there, and those times might seem pretty significant sometimes. Unfortunately, I did not check performance insights at that time (and, besides, it might not even be available back then), but now I am wondering if having client-side only cold/warm page load details would be enough to troubleshoot or if we might also need server-side “cold/warm” information there? In reality, it’s, likely, both of those pieces that we may need?
Either way, curious to see how far Microsoft can take this tool – looking forward to this feature going GA.

